Have you ever been curious as to what your anaesthetist is getting up to on their laptop during long cases? Me neither, but I always generally assumed they were trading Bitcoin, solving the Riemann hypothesis and buffing their Tinder profile.
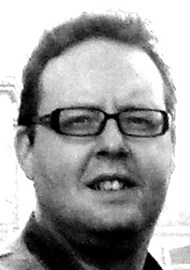
However, I recently discovered that one former colleague of mine was apparently engaged in forensically taking down three of the most retracted authors in medical literature and forcing retraction of what has been described as the most influential trial in the history of nutritional epidemiology [1].You may not have heard of John Carlisle, but he has quietly played a substantial role in changing the way we look at data fraud and medical publication in general. He kindly caught up with me on a frosty winter evening from his home in Devon.

Hello John and welcome. First of all, can I just clarify you don’t have any academic affiliation particularly, do you?
None at all. I’m not employed by any academic institute and never have been.
Do you get any funding from any institutions for what you do?
No, the only money sort of indirectly would be as an editor for Anaesthesia, but I get paid the same as all the other editors and do the same work in terms of editing the papers they’re assigned, or maybe rejecting them. So the work I’ve done on fraud, there’s been no financial gain at all associated with it.
Actually, I was once offered money by a short seller in New York who was looking out for companies that are selling products that he thinks were slightly dodgy, and he asked me to look at some information from a drug company in the process of trying to get a drug into market.
So you have no conflict of interest at all, really, you’re just following your intellectual curiosity. Do you have any postgraduate degrees in terms of a DM or PhD?
*Laughing* No, I’m completely self-taught.
What you do – staring at spreadsheets of raw data for hours on end (let alone anaesthetics!) – would seem to require an immense boredom threshold. Was this obvious earlier in life?
I was deemed as being a bit weird as a child, but in a nice way. I’d read lots of nature books and would tell people in the dorm (I was at a boarding school) weird facts about this animal, this volcano or this bit of palaeontology.
I went to Medical School in Bristol and I was an anaesthetic registrar in the Southwest. In 1997 I found myself in Plymouth and I was thinking well, I ought to do something for my CV. A job came up with Cochrane in Copenhagen and I thought, OK I’ll give that a go. During the interview, they asked if I knew anything about meta-analysis and I said, er… no!
So you didn’t have any sort of postgraduate training in medical statistics, computer science, anything like that?
Oh no! I got the taste for doing meta-analysis with Cochrane, but not in a novel way; I was just doing what everyone else was doing. The Cochrane Collaboration people said, ‘well John, you’ve been editing lots of other people’s systematic reviews but you haven’t actually done your own. Maybe it will give you a bit of an insight as an author and you won’t be so critical of other authors!’ They had a title that had been registered by another registrar, but she was on maternity leave, so it was sort of sitting there with nothing happening to it. That’s where I came into contact with papers by Yoshitaka Fujii, because the systematic review was about drugs to prevent postoperative nausea and vomiting.
"I got the taste for doing meta-analysis with Cochrane, but not in a novel way; I was just doing what everyone else was doing"
I asked Cochrane what to do with his papers because, in 2000, a letter had appeared in a journal saying a lot of his data looked fishy. Cochrane’s approach was that, as nobody had investigated his papers and none have been retracted, we can’t exclude them on the basis of hearsay but they said I could do a sensitivity analysis, so I excluded his papers just on the possibility that there were problems with his work. Four years later, I was writing a paper for Anaesthesia about methods in meta-analysis and I had some quite nice graphs showing how Fuji’s results were really homogeneous, with a complete lack of natural data variation compared with all the other trials (183 of Fujii’s research publications have since been retracted, and 47 other papers have received an expression of concern).
After that, the anaesthetic communities started looking at other anaesthetists’ research data. There was a guy called Scott Reuben [25 retractions] in the US and an anaesthetist called Joachim Boldt [186 retractions- current record holder]. I wrote to Steve Yentis who, at that time, was the editor in chief of Anaesthesia, saying ‘you’ve published this editorial mentioning my work; would you mind organising people who know what they’re doing to look at these papers and maybe get an investigation going please?’ I spent a couple of years, from 2010 to 2012, thinking about what to do.
And you hit on looking at ‘Table one’, the most boring, dull, seemingly irrelevant part of the paper that people like me never even glance at?
Well, in the letter in 2000 commenting upon some dubious features of Fujii’s papers, those authors had looked at stuff that happened after the two or three groups were randomised and they were allocated to different interventions. You had no way of knowing what pattern of results to expect because it depends upon whether there’s an effect of the drug versus placebo or whatever.
I thought it would be better to look at a piece of the research where you know what the overall pattern of results should be, such as the measurements conducted before you’ve exposed the participants to different interventions, like ‘Table one’ where you can look at heights and weights and categorical variables as well and you know that you should generate a uniform distribution of P values from that data. A single P value by itself is uninformative, but building up the distribution of P values can be highly informative. So what I did was look at the calculated P values for Table one, and thought what’s the probability of getting those P value distributions? You can look at them all together and do various statistical tests to see whether the distribution of P values itself is weird.
And that was the smoking gun with Fujii and the others?
Well, it was the piece of the jigsaw that most observers found least biased, most palatable. I was able to look at what would be considered relatively few papers when you’re looking at summary statistics, usually by one author or group of authors. It’s much more interesting when you start looking at spreadsheets of raw data which are much more information dense. With some of them, it was just devastatingly obvious that if you were to ask a child to make up a spreadsheet, they may well do a better job.
Would you like to just talk us through what you were looking at in the 5000 papers study, in high impact journals [2]?
People would come up to me at anaesthetic conferences and say ‘John, well done, but you’re damaging our reputations. Why don’t you look at other specialities?’ So I thought, well, rather than look at papers that people already have suspicions about, why not be completely ignorant and naive and just look at all papers in the literature. I looked at all randomised trials published in a 10-year period in six anaesthetic journals, the New England Journal of Medicine and JAMA.
And you stumbled on the PREDIMED study – the ‘Jewel in the Crown’ of nutritional epidemiology?
Yes, the PREDIMED study was a randomised controlled trial of just over 7000 Spaniards that were allocated to one of three dietary interventions, the hypothesis being that a Mediterranean-type diet will reduce your chance of having a major cardiovascular event. Of course, to me it was all just rows of data on a spreadsheet. The code I’d written to calculate probability came up with a startingly small number and, although I was saying earlier that when you look at ‘Table one’ it should have a uniform distribution of P values, the value of this P value was about 26 zeros after the decimal point. Hats off to New England Journal for taking it seriously. It transpired some of the investigators allocated whole households to an intervention and I think one investigator must have allocated a whole village to just one intervention. The problem was the statistical analysis assumed the individuals were independent of each other and you’d have to adjust the analysis if you knew that they hadn’t been allocated individually. The journal eventually retracted the original paper and published a revised paper on the same day, but it’s still very controversial.
Is it true you get up at 4:30 in the morning?
It was all down to our cat, Wizard, because we didn’t have a cat flap and he would scratch on the carpet to be let out when he needed to attend to nature. That was often between 4:00 and 5:00, and I’d make a cup of tea and start going through an Excel file of data.
This isn’t a very popular, rewarding activity that makes you flavour of the month, and you are very careful also not to make direct accusations of fraud and misconduct.
I’m just using normal statistical tests, but I just thought of applying them to an area people usually don’t bother with – generating P values for table one in randomised control trials and such-like. I haven’t invented anything unusual. When I open up a data spreadsheet, I’ll do a colour-coding usually without really looking at the variables in the columns. You can conditionally format the numerical content of cells so that you can colour-code them a range of colours. For instance, green with a very small number and red with a high number, and you will find repeating patterns will jump out at you. I look for repeated rows and repeated patterns between columns. I’ll also look at the trail digits, so the digit furthest to the right depending upon the variable being reported. Of course, you’d expect a uniform distribution of the trail digit. Then I’ll look at whether the spreadsheet data match the summary information presented in the paper, and run the same statistical tests.
You’ve sort of accidentally invented a whole new field of academic endeavour which, to be frank, doesn’t happen all that often in the day surgery unit in Torquay.
But, of course, this all is happening at the same time as the advent of AI. I’m sure you could quite soon get AI to generate convincing raw data spreadsheets and we shouldn’t be able to spot it because it will be employing the same understanding that we do.
A very sobering thought indeed. John, thanks for your time and telling your story. Keep up the good work!
References
1. Estruch R, Ros E, Salas-Salvado J, et al. Primary prevention of cardiovascular disease with a mediterranean diet supplemented with extra-virgin olive oil or nuts. N Engl J Med 2018;378(25):e34.
2. Carlisle JB. Data fabrication and other reasons for non-random sampling in 5087 randomised, controlled trials in anaesthetic and general medical journals. Anaesthesia 2017;72(8):944–52.


